Remote sensing is an umbrella term to describe the many different ways to collect information about an object or phenomenon without making direct physical contact with it. Using the electromagnetic spectrum, remote sensing instruments can measure things like the height of trees, species of trees, and more.
In addition to the visible light spectrum (what we humans can see with our eyes), there are many more wavelengths on the electromagnetic spectrum that remote sensing can measure and help us “see”. For example, some of the most useful wavelengths of light for measuring forests are in the shortwave infrared spectrum.
Using remote sensing in forestry projects could vastly cut verification and monitoring costs, but each instrument performs best in a different situation. In this article, we’ll do an overview of all the different types of remote sensing and their best applications.
But before we dive into the five most common technologies, we have to keep in mind a few caveats. First, all of these technologies behave differently at different scales. Imagine analyzing a drone image of a tree, where there may be hundreds of pixels representing that tree, and then compare that to a satellite image where each pixel is 30 meters wide and there are half a dozen trees inside. There’s a big difference in what those two images are telling us.
Second, we have to keep in mind things like:
- Cost (the best data is expensive to capture)
- Availability (the best data is rare, covering only a fraction of the landscape)
- Cumbersomeness (the most information-dense data may be a terabyte or more per hectare)
Another related factor is repeat time: how frequently can we take those snapshots? Low-resolution data can be available on a daily basis, while high-resolution data takes longer to process and is available less frequently. These are challenging trade-offs, as we can’t always afford to collect the best data over and over again.
In this article, we’ll focus on five major technologies: Imaging, Photogrammetry, Radar, Hyperspectral, and LiDAR.
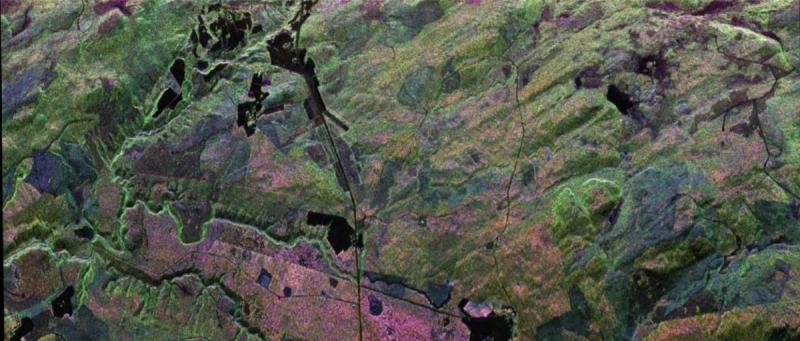
1. Imaging
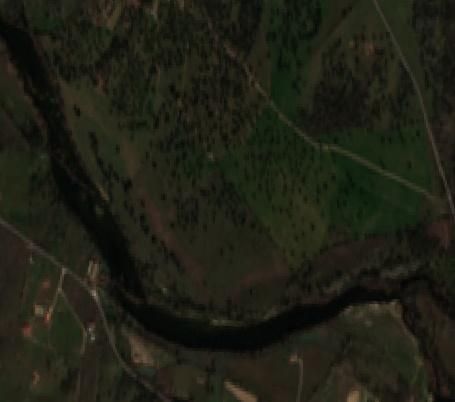
Imaging refers to taking pictures of the Earth from space using satellites. This can be done at any resolution. At Renoster, we like to categorize imagery into three different resolutions – Low-resolution images have pixels that are larger than 50 meters in size, medium-resolution images have pixels that are 5-50 meters in size, and high-resolution images have pixels that are smaller than 1 meter. This means that high-resolution images capture many pixels of each tree.
These categories matter a lot. Using low and medium-resolution imagery allows us to look at pixel values and infer things about the clumps of trees inside them. With high-resolution images, we need to start looking at several pixels and clumping them together into objects. The data analyses are totally different, and much more challenging for high-resolution images. With a low-resolution image we can often relate color ratios back to characteristics about the trees, but with a high-resolution image we need to account for shadows, tree branches, and textures that make up bits and pieces of trees.
The most common and abundant type of imaging out there is medium-resolution imagery provided by two satellite constellations, Sentinel-2 and Landsat. These images are collected by the European Space Agency and the United States National Aeronautics and Space Administration (NASA), respectively, are free, and are fairly easy to work with. Most people access this data on a platform called Google Earth Engine (different from Google Earth). Both these satellites measure shortwave infrared wavelengths and are therefore useful for describing forest canopy cover and history. Landsat has been around since 1984 and can tell us a lot about what has happened to the forest in the past.
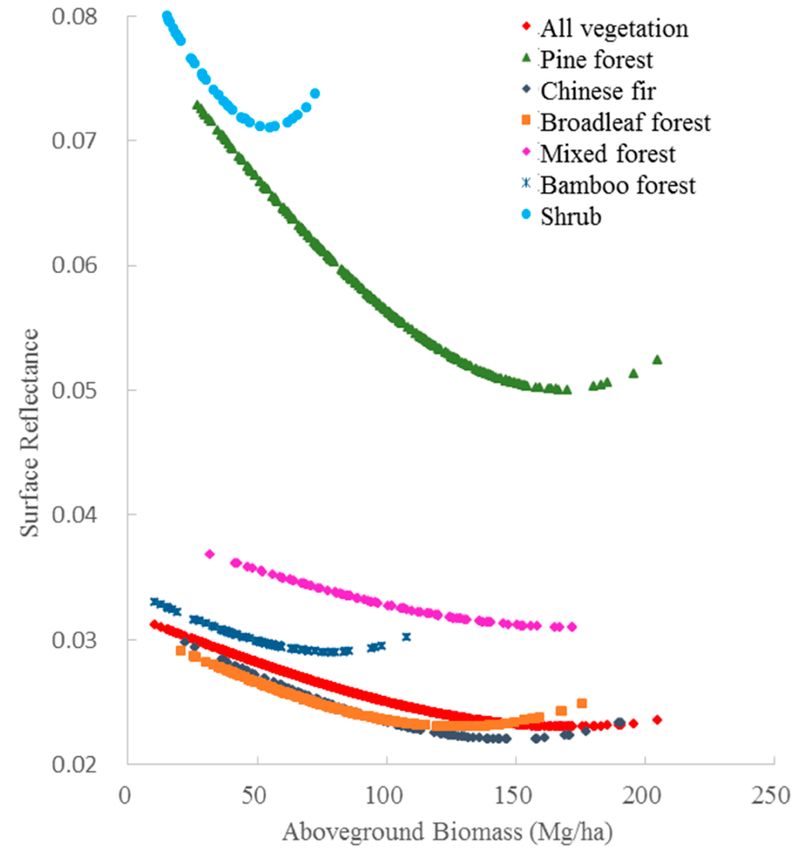
The most important thing to note about medium and low-resolution imaging is that it alone is not enough to measure forest carbon (or create forest inventories). The reason for this is that these sensors saturate as forests get larger. Their sensors are not able to tell the difference between forests with a lot of wood and forests with a medium amount of wood. At a certain point in a forest’s lifecycle, the canopy color just becomes fixed, and these common medium resolution imaging techniques fail us. Nevertheless, you will find many scientists trying to scrape as much information as they can out of these free datasets, often making carbon models that are not particularly suitable for small area estimation.
Finally, low-resolution can be very useful because it can image the entire planet every day, tracking wildfires, monitoring seasons, and observing climate trends. The most common low-resolution sensor used these days is called MODIS, and it is also available in Google Earth Engine.
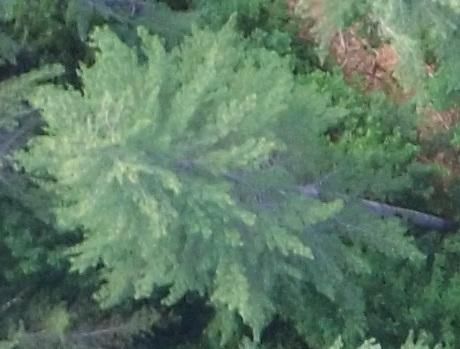
2. Photogrammetry
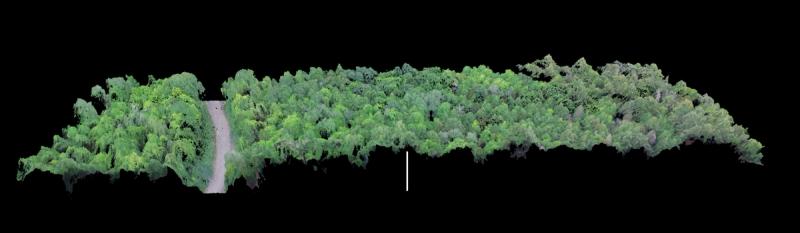
Next, we have photogrammetry. This refers to the reconstruction of 2D images into a 3D rendering using trigonometry. We can take high-resolution images from drones, planes, or satellites and calculate the height of objects based on their offset in each picture. This is the same process that happens in our brain when we construct depth perception with our two eyes.
Photogrammetry can be used to estimate forest carbon because it can measure tree height and structure, but it comes with an important limit. If you can’t see the ground, you can’t know how high your trees are. This is a major problem - if an estimated tree height is wrong even by a couple of meters, resulting carbon numbers are going to be very wrong. Thus, photogrammetry only really works for open canopy forests or when paired with another ground-sensing technology like LiDAR. This has prevented it from being adopted at scale for measuring forest carbon stocks.
Photogrammetry only provides information about the surface of trees. If there is no information on the ground’s level for the forest’s area, it will be impossible to accurately estimate the height of trees and, as a consequence, their carbon content.
Photogrammetry is a bit of a newer player in this space. Perhaps we’ll one day have algorithms that can intuit ground height. Perhaps we’ll have LiDAR everywhere that we can use in conjunction with images.
One major limitation today is that it’s difficult to acquire and process at scale. Most people use drones to capture this data, but drones have a limited battery life that precludes them from measuring thousands of hectares (like, a carbon project). Satellite data is increasingly being used to capture this data using the same principle - taking high resolution images of the earth from multiple vantage points. So far, this data is quite expensive. However, in the coming years we could be seeing a lot more of it.
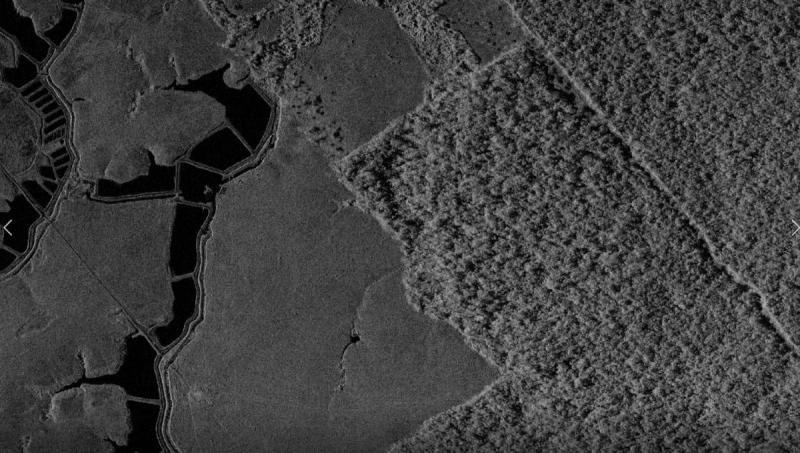
3. Radar
Radar was originally an acronym for “radio detection and ranging” and is a form of remote sensing that uses radio waves to measure objects in space. Most of us are familiar with the fundamentals, radio waves are sent out from a transmitter, they bounce off an object, and then are read back in to a receiver. The time and intensity of that signal tells you about the object in question, or in this case, the tree.
The most important thing to note about radar is that not all radar is equal. The use cases for radar depend a lot on the frequency of radio waves being shot out. Shorter wavelengths (C and X-bands) essentially just bounce off the forest canopy. These shorter wavelengths are still okay for deforestation monitoring, but can’t be used for forest carbon.
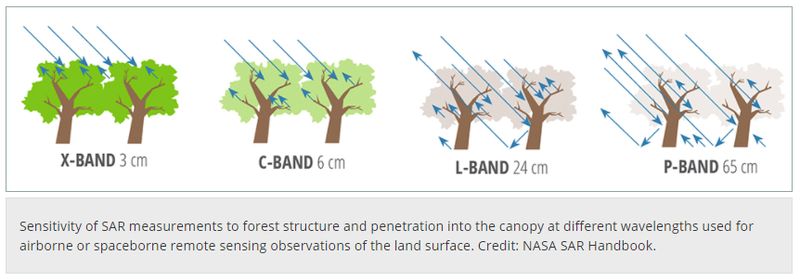
Longer wavelength radar (L- and P-bands) can penetrate into the forest and bounce back, giving insight into a forest’s structure. These types of radar can be used to estimate forest carbon, although L-band radar doesn’t quite do the trick in large forests.
C-band radar is the most common right now. There are no P-band radar satellites in orbit right now, but the European Space Agency is launching one in 2023 that should be useful for making forest inventory maps.
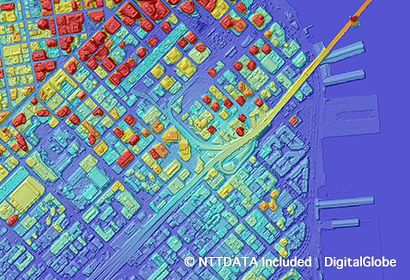
Finally, we want to mention a new technology: high-resolution radar. There are a handful of private companies selling X-band radar from space with spatial resolutions up to 25 cm. X-band radar tends to bounce off the forest canopy, but 25 cm resolution is so high we can make out the crowns of individual trees. We think there might be a lot of unexplored potential here.
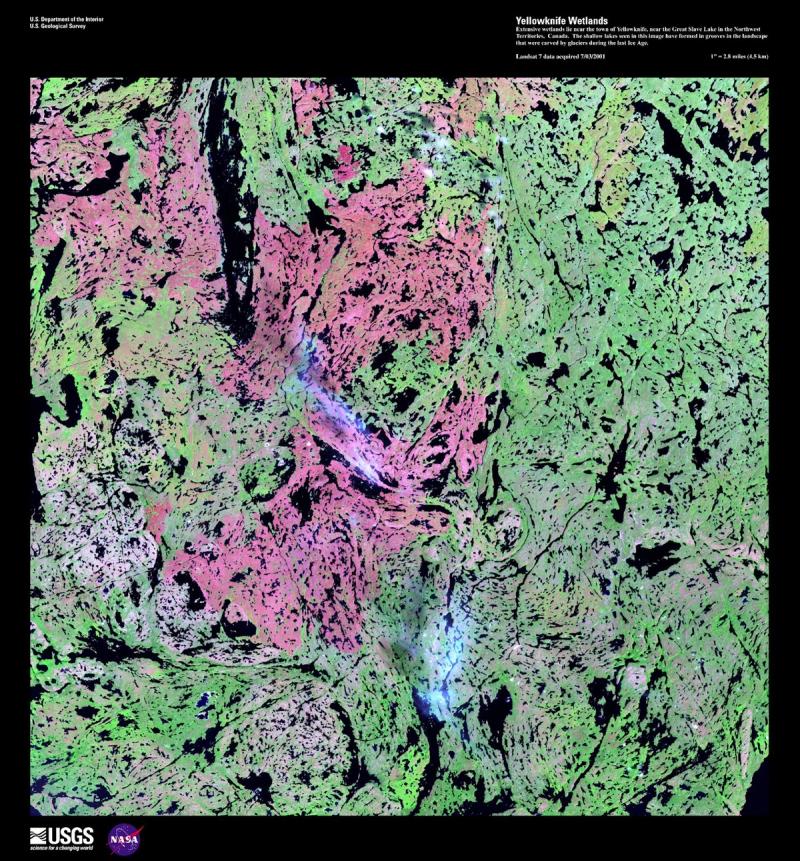
4. Hyperspectral
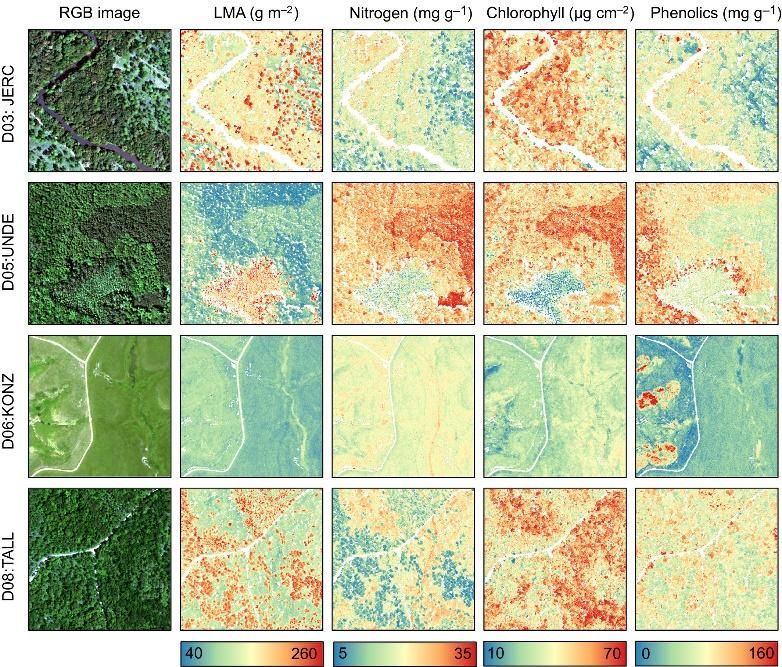
Hyperspectral imagery is a form of imaging that in contrast to regular imagery, can image up to 1000 different colors. Human beings are capable of seeing only a tiny sliver of the electromagnetic spectrum, and we do so by combining only three colors of light together in different ways (red, green, and blue). Hyperspectral imagery on the other hand is capable of combining 1000s of colors of light into millions of different permutation and ratios.
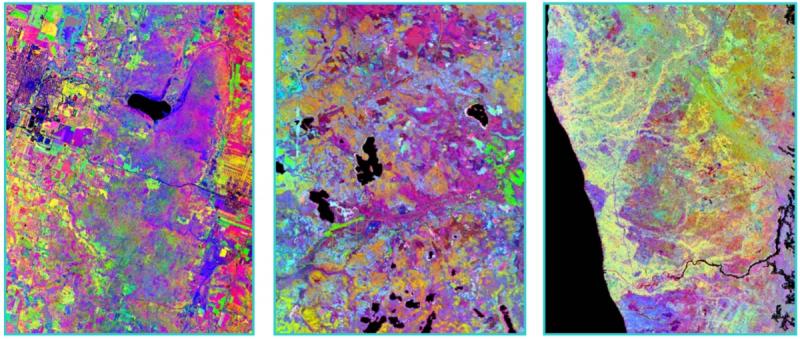
All trees may look green to us, but each tree species actually has a slightly different color (or spectral signature). Hyperspectral cameras are just about the only tool that can distinguish these differences and tell us about tree species and biodiversity.
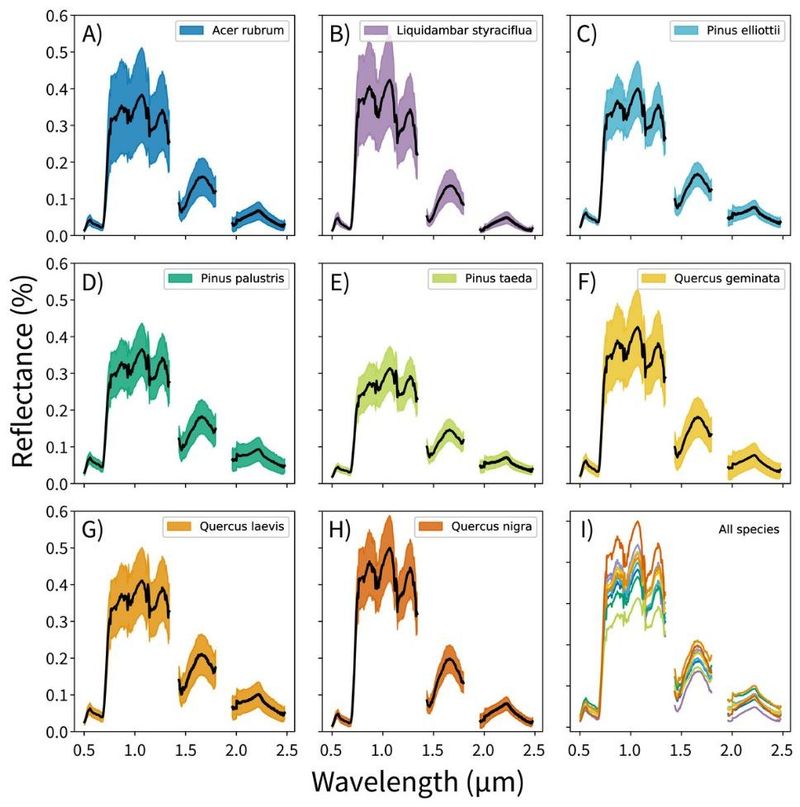
Because every molecule emits a slightly different color, hyperspectral imagery can also be used to measure chlorophyll content, nitrogen content, phosphorus, lignin, carbon, and more. This is invaluable information for determining tree health and ecosystem types from afar. Hyperspectral imagery’s ability to measure forest carbon is a little more tenuous, with some scientists having success in limited circumstances. These sensors can run into the same saturation problems as other types of imagery.
Hyperspectral comes with some major drawbacks:
Firstly, it’s wildly expensive. Unlike other datasets, because hyperspectral imagery is often only useful for forest ecology, governments don’t like to pay for it.
Next, working with this data is extremely difficult. For each and every pixel in an image, there may be over 1000 numbers associated with it. This equates to enormous file sizes and georeferencing issues, and it’s a big machine learning challenge to boot. Working with this is an exercise in data mining and dimensionality reduction; there’s simply an overwhelming amount of data to useful signal.
Finally, not all hyperspectral data is equal. For forest science, we need hyperspectral data that includes shortwave infrared bands. There are a lot of people out there selling ‘partial’ hyperspectral datasets which won’t get you very far in modeling forests.
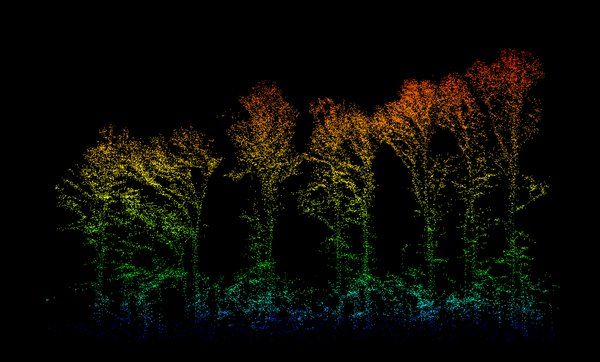
5. LiDAR
Like Radar, LiDAR stands for Light Detection and Ranging. It works by shooting a laser out of an aircraft (or satellite) and measuring the time that it takes for that light to bounce off an object and come back to measure the object’s distance from the sensor. If this is done thousands of times per second, this can be used to generate 3D scenes of the forest. This is similar to photogrammetry, but importantly the laser penetrates to the forest floor, providing a measure of tree height above the ground.
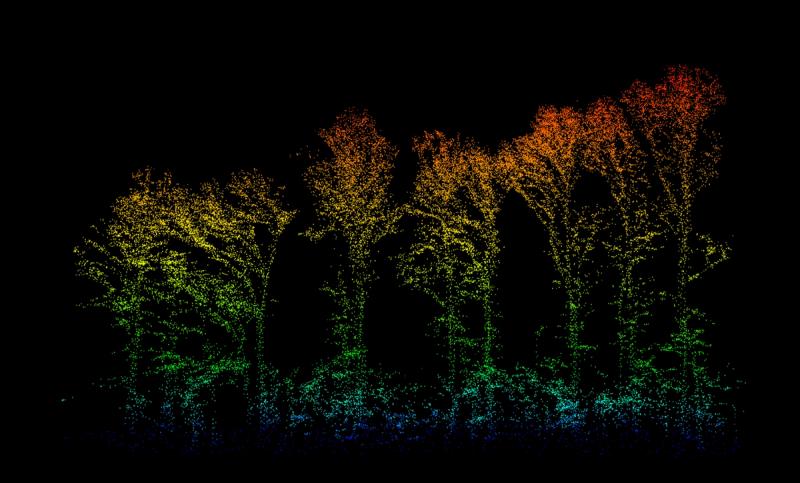
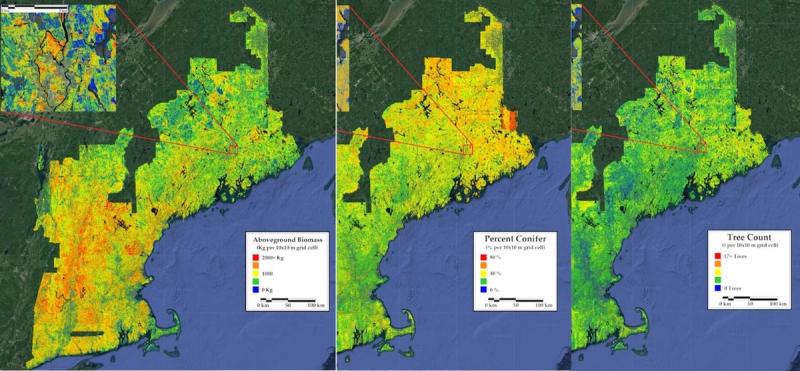
LiDAR is the mostly-undisputed king of forest remote sensing. Because LiDAR gives us a full 3D rendering of forest structure, we can use it to estimate carbon, tree number, basal area, wood value, and just about anything else that you would want to know about the forest except for species. What’s more, the governments of most developed nations have flown LiDAR over their land, so much of it is available for free.
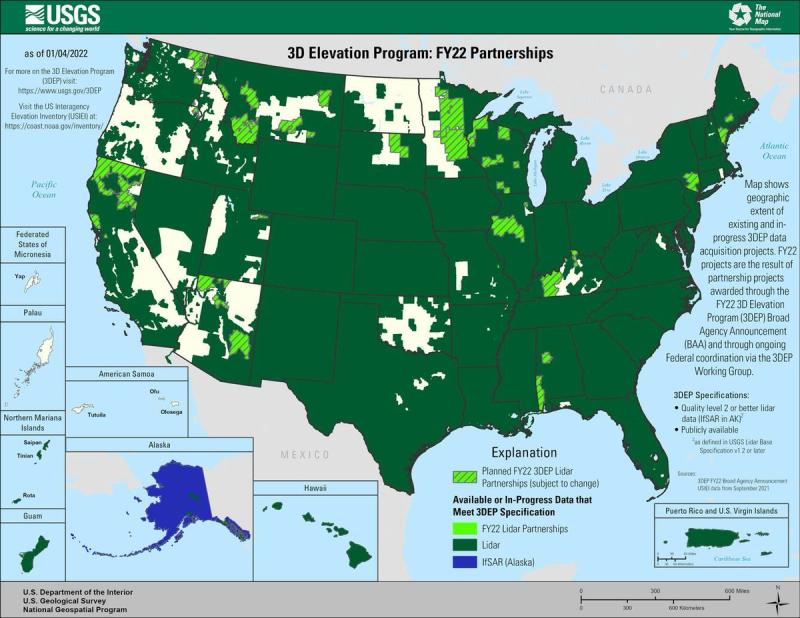
In areas where free LiDAR is not available, it tends to be fairly expensive - about the same cost as a traditional ground-based forest inventory. Nevertheless, every major timber company has their own LiDAR inventory program, so it is pretty well-accepted by the forestry community as a solid remote sensing method at this point. Forest carbon registry bodies still don’t allow LiDAR to be used for verification. This is partially because it’s difficult to get a grasp on carbon uncertainty, but mostly because there is a lot of resistance to change and adaptability. There have been innumerable academic papers demonstrating LiDAR’s effectiveness at measuring forest carbon. If LiDAR is good enough for scientists, good enough for timber industrialists, and good enough for governments, we think it should be good enough for carbon protocols.
Spaceborne LiDAR exists as well, but it's very different from its airborne counterpart. Instead of shooting many small laser pulses out, spaceborne LiDAR shoots out a handful of pulses that end up being about 25 meters wide when they hit the ground. They're not able to provide 3D renderings of the forest, but instead provide samples of forest height where the laser has happened to hit. The most important LiDAR satellite in orbit right now is called GEDI, and it can certainly be useful for estimating the forest carbon of whole countries, but hasn’t quite been demonstrated to work on small scales.
Conclusion
So which remote sensing technologies can solve which problems?
- Forest carbon and inventories - LiDAR for sure. Some radar (P-band and some L-Band). Some photogrammetry (under the right circumstances)
- Forest history - Moderate-resolution imagery (Landsat).
- Disturbance and deforestation detection - Moderate and high-resolution imagery. Radar (all bands, but especially the cheap and abundant X and C-bands).
- Tree Species and biodiversity – Hyperspectral imagery
- Forest health and ecology – Hyperspectral imagery
What are some of the most exciting upcoming technologies?
- The ESA’s P-band biomass satellite
- Photogrammetry from space (cheaply)
- High-resolution radar from space
Finally, we have to remember that not all remote sensing technologies are suitable for everything. Despite this, you will find scientists using every technology for everything, mostly because they can’t afford the expensive technologies. It takes a detailed scientific eye to read an academic paper and read between the lines to determine if the map is any good for your use case. You’ll find no shortage of folks modeling biomass using Landsat or Sentinel, even though those maps are only good “at scale”. Consulting experts in remote sensing is the first step to take to avoid wasting energy, time, and money.


